Visualizing Statistics in Minecraft

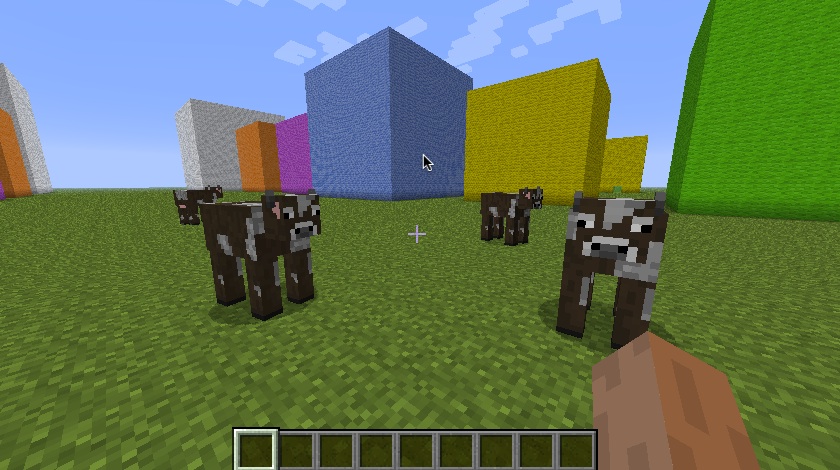
Data about public sector spending is often hard to understand and compare. Statistics about government is often presented in tables. In this hack I have used open data from Eurostat (the EU statistics agency) about government expenditure for a set of countries and rendered sets of boxes in a Minecraft world. This makes it possible to explore the data by walking (flying) around the world. Boxes for expenditure data is ordered as General public services, Defence, Public order and safety, Economic affairs, Environment protection, Housing and community amenities, Health, Recreation culture and religion, Education, Social protection. ...

August 5, 2012 · Peter Krantz

Data visualization tools

With the increasing availability of big/open data more people discover a need to make it understandable. One way of understanding data is by looking at it. As I have received a lot of questions lately here is a roundup of tools you can use to create visualizations of data. I have divided the tools into three groups: Libraries for using in your own web project. Client side applications that generate a standalone visualization. Hosted applications to which you upload your data and create visualizations in the cloud. 1. Visualization libraries for using in your own web project A general recommendation is to stick with libraries that work on as many client platforms as possible. This means staying away from libraries that require Flash and Silverlight. The following libraries use javascript and SVG with various fallbacks and should work well on modern phones and tablets. ...

February 12, 2012 · Peter Krantz
A game image where the player controls a pong paddle with his hand

Pointless Pong with Processing and the Kinect

I did a quick excursion using the Microsoft Kinect in Processing with Daniel Shiffmans excellent Kinect library. Source code for Kinect Pong is here.

January 2, 2012 · Peter Krantz

Visualizing Eurostat data with the JIT

A small visualization hack for the Eurostat Hackday on december 16.

December 18, 2010 · Peter Krantz

Social Media in the Swedish Public Sector

Andrew Krzmarzick, Govloop community manager, asked me which swedish government agencies are using social media to communicate with citizens. The twitter message space is too short for an answer so here is a more thorough reply. I will specifically look at Twitter which seems to be gaining popularity in the swedish public sector. Use of social media tools in the public sector is in its infancy in Sweden. In a study conducted by the Stockholm Chamber of Commerce in 2009 (PDF) , around 12% of agencies reported that they were using social media channels in their communication. In another study by the Swedish Public Relations Association 75% of PR managers were evaluating the use of social media but only 5% had involved social media in the communication strategy. Many agencies are trying out new tools to see how they fit in their communication strategy. Most are using them as a news feed (one-way communication) and do not reply to questions. The number of followers varies greatly. Some examples: ...

April 8, 2010 · Peter Krantz

Re-enacting Video Transition Effects

Please note the video progress bar. Via Jim Carlberg’s Finstilt.se.

August 31, 2007 · Peter Krantz

Visualizing web site interlinkage using Processing

Processing is an open project initiated by Ben Fry (of MIT fame) and Casey Reas (UCLA Design). From the processing.org web page: Processing is an open source programming language and environment for people who want to program images, animation, and sound. Processing is developed by artists and designers as an alternative to proprietary software tools in the same domain. I have been dabbling with it for a while and have come to like it’s simplicity. The downside is that it sometimes demands a lot from your computer’s processing power. ...

February 11, 2006 · Peter Krantz