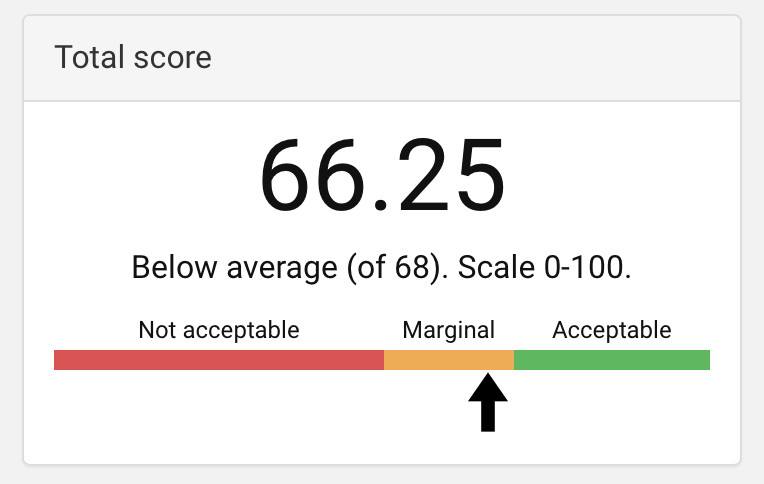
The first step to find out what users think

Empowering everyone to evaluate usability can improve the digital workplace. Here is how you take the first step with userpoll.io. Bad software makes a bad digital workplace Organizations that have been around for a few years typically have a large number of legacy systems. Ages ago, when they were created, it is likely that no one cared about their usability or design. Users were used to obeying software and taking a course in order to be able to file a report....

June 7, 2015 · Peter Krantz

Stockholm City Hall

April 13, 2014 · Peter Krantz

Train ride

March 5, 2014 · Peter Krantz

Haptic interface to e-government service - we need more APIs

A small hack to simplify the application for temporary parental benefit for care of children from the Swedish Social Insurance Agency (Försäkringskassan). Typically this involves multiple steps in a web browser. Now, moving a doll to a square and the computer will send relevant information to kindergarten and the social insurance agency.

May 23, 2013 · Peter Krantz
A lego figurine contraption

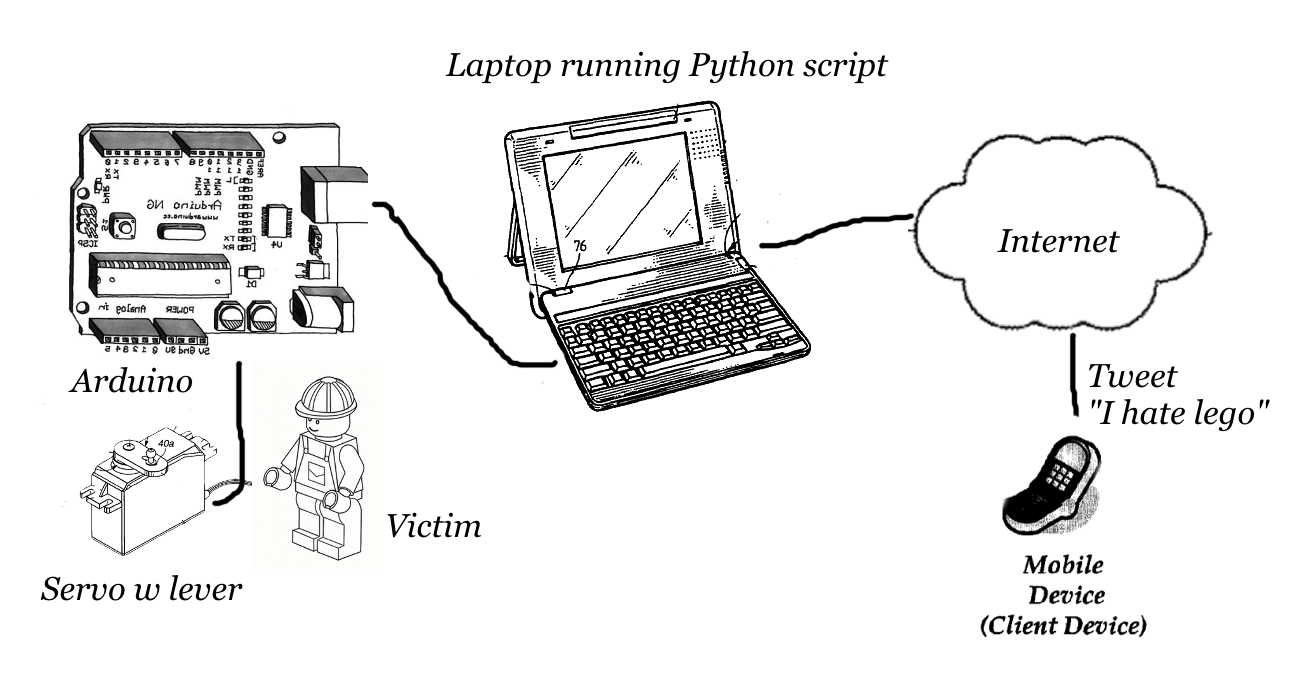
Method and system for monitoring Lego hate on Twitter

(Cunningly illustrated using patent application art). A small Python script monitors twitter for the phrase “I hate lego”. Upon finding a matching tweet it sends a signal to an Arduino board that turns a servo pushing a small lego figurine over the edge of a table. Live example here (at approx 7:30). A hack for the Make All event in Stockholm.

August 18, 2012 · Peter Krantz

Meanwhile, on the west coast of Sweden

A small crab attacked my GoPro camera.

August 8, 2012 · Peter Krantz

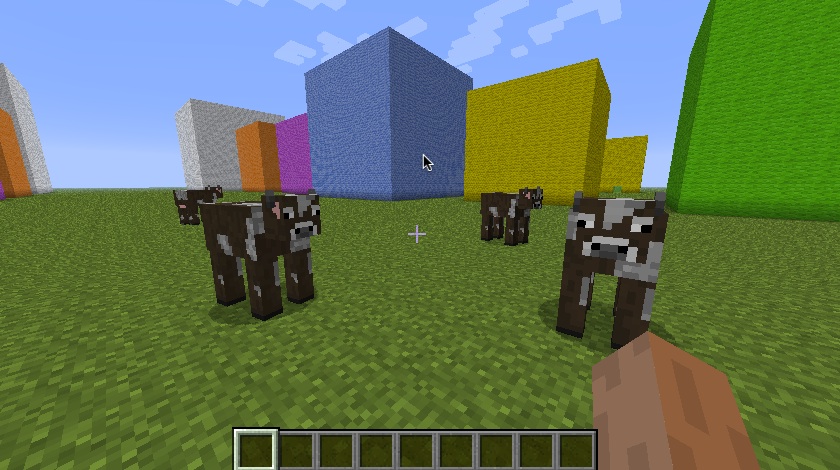
Visualizing Statistics in Minecraft

Data about public sector spending is often hard to understand and compare. Statistics about government is often presented in tables. In this hack I have used open data from Eurostat (the EU statistics agency) about government expenditure for a set of countries and rendered sets of boxes in a Minecraft world. This makes it possible to explore the data by walking (flying) around the world. Boxes for expenditure data is ordered as General public services, Defence, Public order and safety, Economic affairs, Environment protection, Housing and community amenities, Health, Recreation culture and religion, Education, Social protection....

August 5, 2012 · Peter Krantz

The Queue Ticket UX

The queue ticket machine in Uppsala, Sweden.

June 2, 2012 · Peter Krantz
Golden house facade

The Art Museum of Sven-Harry

March 26, 2012 · Peter Krantz

Publishing Open Data - Do you really need an API?

As open data is gaining momentum an increasing number of organizations are thinking about ways to make their data available for others to use. Here are some thought on how to approach design issues when making open government data available. TL;DR See if it is possible to publish your open data as file dumps instead of building advanced API:s that force entrepreneurs to integrate their apps with your infrastructure. A fictional background It was supposed to be a regular day for John at the server facility at the government weather agency....

March 19, 2012 · Peter Krantz