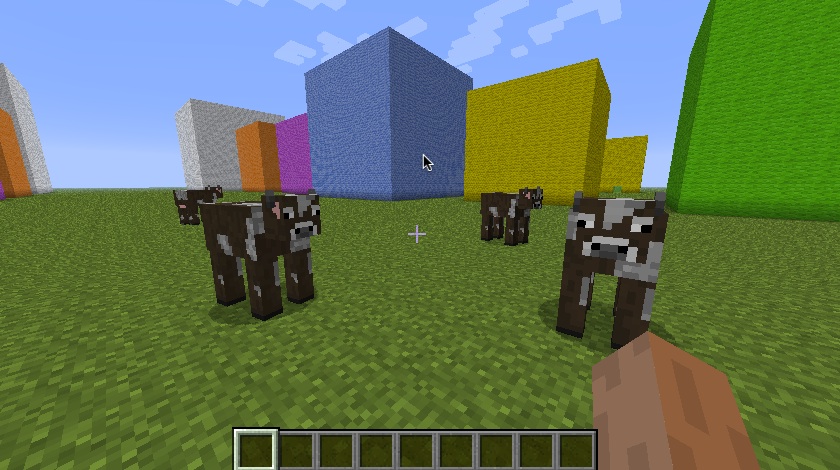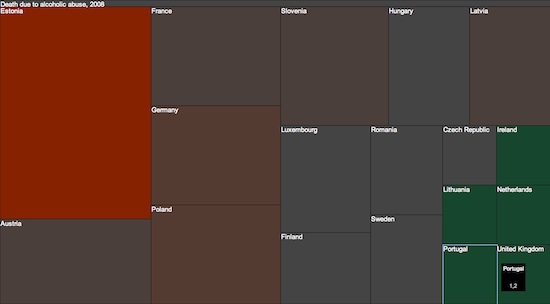
Visualizing Statistics in Minecraft
Data about public sector spending is often hard to understand and compare. Statistics about government is often presented in tables. In this hack I have used open data from Eurostat (the EU statistics agency) about government expenditure for a set of countries and rendered sets of boxes in a Minecraft world. This makes it possible to explore the data by walking (flying) around the world. Boxes for expenditure data is ordered as General public services, Defence, Public order and safety, Economic affairs, Environment protection, Housing and community amenities, Health, Recreation culture and religion, Education, Social protection....

